dynamite-plunger plotについて
kymさんにコメントをいただけた。
消えゆく記憶をつなぎとめるために、細々とブログ続けているのですが、こうして誰かに見ていただけていると思うと、とても嬉しくなります。
なので、「dynamite-plunger plot」について、私なりの解釈を記録しておこうと思った。
私の関係する分野では、ここに記載があります。
Dynamite plunger plots should not be used
EDITOR,―The function of graphical displays is to offer information globally through one only sight. In some occasions, however, they can produce misleading impressions leading to erroneous interpretations. It has been
suggested that, within reason, the ratio of the amount of information should be maximised to the amount of ink.
Bar charts showing the mean value with its error bar, usually referred to as a “dynamite plunger plot” have appeared in several papers of your Journal during the past year. Error bars, however, are not universally defined. They are usually based on the standard error (SEM), which sometimes may be chosen because it is smaller than alternatives such as the standard deviation (SD), leading to confusion of the reader. This type of presentation is to be avoided as it violates Tuffte's principle in that only two numbers are conveyed with a large amount of ink, and any sense of the distribution of the data is lost.
For quantitative data alternative graphical displays―such as dot plots or box and whisker plots, have been suggested instead of dynamite plunger plots. Dot plots show the distribution of continuous data, if the sample size is small (say <50), presenting all the information economically. Box and whisker plots present in ascending order the minimum value, the first quartile, the median, the third quartile and the maximum value. These values are enough to convey the main points about the distribution of the data, also showing the possible outliers.
It is important to construct graphical representations of a publication avoiding too simplistic figures―such as dynamite plunger plots. This plot does not convey adequately the distribution of the data, and may lead to
confusion in the interpretation of the results.
つまり、棒グラフで平均値とエラーバーを示すとき、
-
- SDなのか、SEMなのか、読み手に曖昧に提示してしまう。
- 棒グラフの棒の部分は何の意味ももたない。
- この場合は棒グラフは分布を示す意味が強いので、点で表示するか(n < 50)、箱ひげ図が適当
といったようなこと。
つまり、
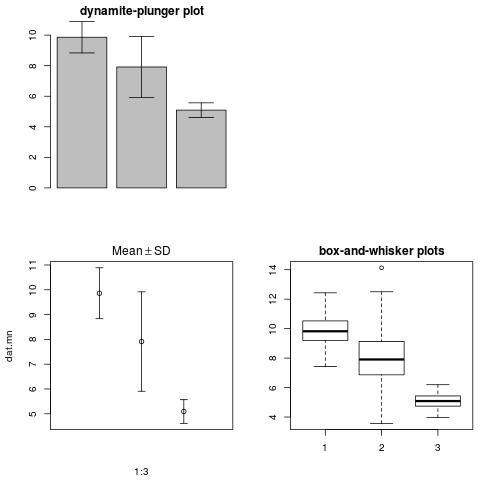
- データが多いとき
> dat <- cbind(rnorm(100,mean=10),rnorm(100,mean=8,sd=2),rnorm(100,mean=5,sd=.5))
> dat.mn <- apply(dat,2,mean)
> dat.sd <- apply(dat,2,sd)
>
> jpeg("dpp.jpeg")
> layout(matrix(c(1:2,0,3),ncol=2))
> par(mai=c(.7,.7,.3,.1))
> library(gplots)
> barplot2(dat.mn,plot.ci=TRUE,ci.u=dat.mn+dat.sd,ci.l=dat.mn-dat.sd,main="dynamite-plunger plot")
>
> plot(x=1:3,y=dat.mn,xlim=c(0,4),ylim=c(min(dat.mn-dat.sd),max(dat.mn+dat.sd)),xaxt="n"
+ ,main=expression(Mean%+-%SD))
> arrows(x0=1:3,y0=dat.mn+dat.sd,x1=1:3,y1=dat.mn-dat.sd,length=.05,angle=90,code=3)
>
> boxplot(dat,main="box-and-whisker plots")
> dev.off()
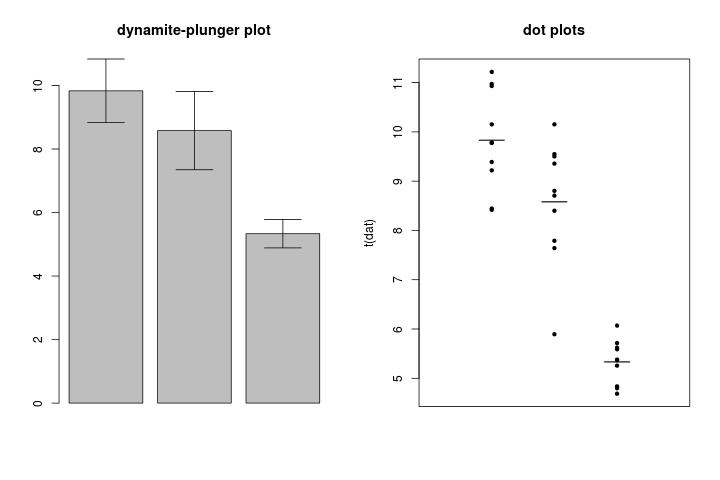
- データが少ないとき
> dat <- dat[sample(nrow(dat),10),]
> dat.mn <- apply(dat,2,mean)
> dat.sd <- apply(dat,2,sd)
>
> jpeg("dpp2.jpeg",width=720)
> layout(t(1:2))
> barplot2(dat.mn,plot.ci=TRUE,ci.u=dat.mn+dat.sd,ci.l=dat.mn-dat.sd,main="dynamite-plunger plot")
>
> matplot(t(dat),xlim=c(0,4),pch=20,col=1,xaxt="n",main="dot plots")
> arrows(x0=1:3-.2,y0=dat.mn,x1=1:3+.2,y1=dat.mn,length=.05,lwd=1.5,angle=0,code=0)
> dev.off()

データが少ないときは、全部プロットした方が情報が多くなって正確。
ただ当時、私のまわりでこの意味を理解している人は少なかったように思う。
慣れ親しんだグラフの方が、人は直感的に結果を理解できることが多い。
私も統計を始めるまで、私も本当の意味を理解していなかった。
だから、私は相手に分かってもらえるグラフをいつも考えていました。
でも、最近は、リタラシーも上がってきたのかもしれません。
あと、「dynamite-plunger plot」には、ここにも資料がありました。
